5 Steps to Turning Big Data into Smart Data (Part 2 of 2)
Most data is dumb; it is hard to find, hard to combine with other data, and hard to understand. If data is dumb, then big data is very dumb. Here are five steps to making it smart.
By Lee Feigenbaum, Co-founder, Cambridge Semantics
In Part 1 of this series, we explored key business and technical challenges that often prevent organizations from weaving big data into their day-to-day decision-making processes. We mentioned that smart data addresses these challenges. In this article, we’ll look at five best practices that you can use to start moving from big data to smart data today.
Ultimately, the challenges laid out in the previous article derive from the fact that most data is dumb. Dumb data is characterized by being:
Hard to find: Dumb data requires that we know the exact location of a particular piece of information we’re interested in. We may need to know a specific part number that acts as a primary key in a database or in a Hadoop cluster, or we may need to know particular internal IDs used to identify the same employee in three different systems. To cope with this, we wrap dumb data with basic keyword search or with canned queries—solutions that help us retrieve known data but don’t help us ask new questions or uncover new information.
Hard to combine with other data: Dumb data is very provincial. It has identity and meaning within the confines of the particular silo in which it was created. Outside of that silo, however, dumb data is meaningless. An auto-incrementing integer key that uniquely identifies a customer within a CRM system is highly ambiguous when placed in the same context as data from a dozen other enterprise apps. A short text string such as “name” used to identify a particular data attribute within a key-value store such as MongoDB may collide with different attributes from other big data stores, databases, or spreadsheets when let loose in the wild.
Hard to understand: Even once we find relevant information, we’re limited in our ability to understand dumb data as it is generally not well-described. Dumb data is described by database, table, and column names or document and key identifiers that are often short, opaque, and ambiguous outside of the context of a specific data store. For decades, we’ve been dealing with this by building software that has hardcoded knowledge of what data is in which column in which database table. Hardcoding this knowledge into every software layer from the query layer through to the business logic and all the way up to the user interface makes software very complex. Complex software is prone to bugs and is expensive and time-consuming to change, compromising our ability to deliver the most up-to-date and relevant data to business decision makers in a timely manner.
Because most data is hard to find, combine with other data, and understand, its value ends up limited. The effort and cost needed to effectively use dumb data to drive business decisions is so high that we only use it for a few business problems, in particular those with static and predictable requirements. We might deploy a traditional BI tool to track and optimize widget sales by region, for instance, but we’re not able to apply the same analytic rigor to staffing client projects, understanding competitors’ strategies, providing proactive customer support, or any of hundreds of other day-to-day business activities that would benefit from a data-driven approach.
If data is dumb, then big data is very dumb. With Hadoop and other big data infrastructure, we now have the tools to collect data at will in volumes and varieties not previously seen. However, this only exacerbates the challenges of finding, combining, and understanding the data we need at any given time.
Smart data, on the other hand, is not dumb. Smart data is easy to find, reuse, and consume. It improves the business intelligence landscape by dramatically expanding the business decisions that can be informed by data-driven analytics. Smart data gives us practical capabilities to use data for nearly everything, including the ability to draw on new and unusual sources of data (think unstructured text, social media data, or even spreadsheets) that have traditionally been beyond the reach of analytics. Smart data helps us deal with constantly changing requirements, and it helps us explore and investigate new hypotheses and lines of inquiry cheaply and quickly.
How do you transition from dumb data to smart data? Here are five steps to get started:
Step 1: Add meaning
The first step is to add meaning to your data by richly describing both the entities within your data and the relationships between them. Equally important to describing the meaning of data is where the meaning is described. Dumb data often has its meaning recorded via data dictionaries, service interface documents, relational database catalogs, or other out-of-band mechanisms. To make data smarter, don’t rely on the meaning of the data to be hardcoded within software; instead, link the meaning of the data directly to the data itself.
There are several ways to describe data’s meaning, and the richer the description you choose, the smarter your data becomes. Data’s meaning can include:
- Controlled vocabularies that describe the acceptable values of an attribute
- Taxonomies that capture hierarchical relationships within the data
- Schemas that communicate data types, cardinalities, and min/max value ranges
- Ontologies that declaratively represent rich semantics of data such as transitive relationships, type intersections, or context-sensitive value restrictions
There are two benefits of adding meaning to your data. First, software can respond appropriately (for example, by performing data validation or automatically choosing the right UI widget) to the meaning of different data sets without having to be customized for each. Second, rich data descriptions attached to data can empower business experts to manipulate data themselves without relying on scarce IT or data science personnel for every new dashboard, visualization, or analysis.
Step 2: Add context
The Sisyphean pursuit of a generally unreachable “single version of the truth” belies the importance of context in making data smart enough to be discovered and understood by business decision makers. The lack of context makes data unreliable and hard to trust and decreases the chance that decision makers will rely on it.
Just as meaning is traditionally captured separately from data, so, too, is contextual metadata usually divorced from the data it describes. To make data smarter, you must treat metadata as data. This means directly capturing and maintaining simple metadata such as the author or creation time of a piece of data, but it also means linking data to its full lineage, including the source of the data (e.g., a particular enterprise database, document, or social media posting) and any transformations on the data. Context can also include probability, confidence, and reliability metadata. Finally, data’s context might involve domain-specific attributes that limit the scope in which a particular piece of data is true, such as the time period for which a company had a particular ticker symbol or the position a patient was in when a blood pressure reading was obtained.
By representing contextual metadata alongside the data itself, users can query, search, and visualize both at once. There’s no need to create separate, time-consuming data-load processes that select data from a particular time period or author. There’s no need to login to separate applications to verify the trustworthiness of data within a business intelligence dashboard.
Step 3: Embrace graphs
One of the hallmarks of the burgeoning NoSQL ecosystem is its move away from the rigid tabular data structures of the relational database world. Perhaps the most flexible and expressive of the NoSQL data models is the graph. A graph is a web-like network model; it represents data as a collection of entities linked together via explicit relationships. Graphs have no up front constraining structure, though their structure can be described after the fact. This means that graphs are fundamentally flexible: new attributes or new relationships simply add new edges and nodes to the graph without requiring the rework that a more rigid model (such as the relational model) might require.
Furthermore, graphs act as a lingua franca -- a least common denominator -- for representing information from other data models. For example, relational data easily fits into a graph model (by representing tables as nodes and both columns and foreign keys as edges within the graph). So, too, does data from unstructured text fit into a graph -- as text analytics processes uncover new insights within text, those insights grow the graph by adding new edges and nodes as necessary, even though we might not have known up front what we’d discover in the text. Finally, graphs are ideal for linking data together with its description and metadata -- the meaning and context that we’ve already established as key parts of embracing smart data.
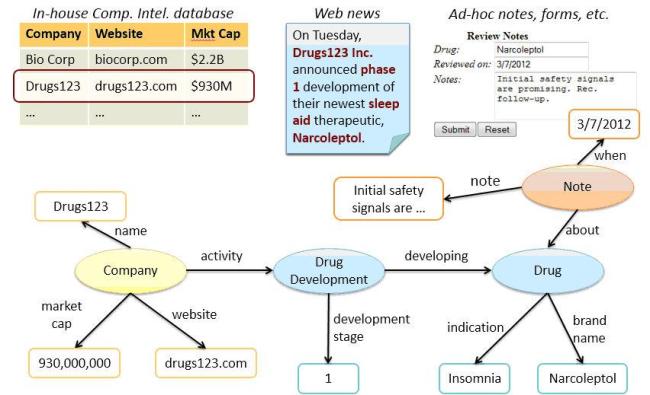
For example (see figure below), a pharmaceutical company might leverage graphs to incrementally pull together information about a potential business development licensing opportunity. Basic company information taken from a relational database can be augmented with market data gleaned from applying text analytics to an industry news article. This graph can then, in turn, be extended with evaluations and annotations that place the licensing opportunity into a richer, decision-making context.
Step 4: Don’t plan too much; iterate instead
Business agility is a key characteristic of smart data. This agility needs to be reflected both in the technology foundation that powers a smart data infrastructure (see Step 3: Embrace graphs) and also in the processes and projects that create, combine, and consume smart data.
The main realization that enables this business agility is that you don’t need to know all of the data and relationships you’ll need up front. Although this is a radical departure from the traditional waterfall approach to data integration projects, it is very much in alignment with modern agile development and agile product management paradigms.
One example of the iterative nature of smart data is the emerging concept of a data lake, which is a logical, unified data repository similar in spirit to a data warehouse but with two key distinctions:
- It can store far greater volumes of data than a typical warehouse would (data lakes are often built on big data infrastructure such as Hadoop)
- It is flexible enough to be used as a lossless store, allowing businesses to ingest arbitrary data as that data becomes available
Data lakes eliminate the need for up-front planning and data preparation, instead promoting a paradigm that pairs just-in-time identification of related concepts with on-demand analytics to deliver insights for unforeseen business decisions.
For example, a large investment bank wants to arm its compliance analysts with data to meet regulatory reporting requirements. Because the specific analyses required are rapidly evolving, a traditional data warehouse would not be possible. By pouring data from accounting systems, trading databases, and portfolio systems into a data lake, however, the compliance analyst can have at-their-fingertips access to data they need to respond quickly to the ever-changing reporting requirements.
Step 5: Adopt standards
The first four steps we’ve presented all deal with how smart data can help you derive more internal value from big data by making it more flexible and easier to understand. However, we work in an increasingly interconnected world, and we can’t ignore the edges of our big data clouds -- the points at which we exchange data with our supply chain partners, regulators, and customers.
Adopting standards is critical to enabling reuse of data on these edges and to avoiding the overhead of classic point-to-point data translations that traditionally consume substantial resources when exchanging data with third parties. Smart data standards come in two varieties:
- Industry standards such as the Financial Industry Business Ontology (FIBO), CDISC in pharma, or HL7 in healthcare. These standards capture the meaning of data across an industry and ensure mutual understanding between organizations.
- Technology standards such as the semantic Web standards RDF, OWL, and SPARQL. These standards provide an agreed-upon way to model and describe the flexible, context-rich, data graphs that form the foundation of smart data.
It’s Not Rocket Science -- Really
At its core, smart data is about acknowledging and coping with the realities of a modern business:
- Data helps make better decisions, but only if it’s available in a timely fashion
- Decisions -- and the data that supports them -- are unpredictable from one day to the next
- Decision makers needs to be able to understand and to trust the data that informs their actions
Moving from dumb data to smart data is not rocket science. It doesn’t require legions of Ph.D.s, sophisticated artificial intelligence, or budget-busting, multi-year monolithic projects. Indeed, you can get started with smart data today, simply by beginning to use flexible data structures that preserve the context and the meaning of your data. Over time you’ll be able to consume more data from increasingly diverse sources, and you’ll find that you have a rich tapestry of data to draw on when faced with a decision. Eventually, you’ll stop thinking about big data vs. smart data because all of your data will be smart.
Lee Feigenbaum is the co-founder of Cambridge Semantics. You can contact the author at [email protected].